

Alea Jacta Est For Bitcoin
Alea Jacta Est For Bitcoin
Bitcoin is at a crucial tipping point just like Julius Caeser was.

To anyone who is interested in the bitcoin market,
For those who doesn’t the history behind the famous quote of Julius Caeser, “Alea Jacta Est”, Julius Caeser was about to cross the Rubicon river with his army and set the Roman Civil War in January, 49 B.C.
That moment was a tipping point to Caeser, as you may guess, he won the battle but the decision to cross the river was crucial.
Bitcoin is about to cross the river, but the market still has to confirm that move, so let’s go see the indicators I’m looking at.
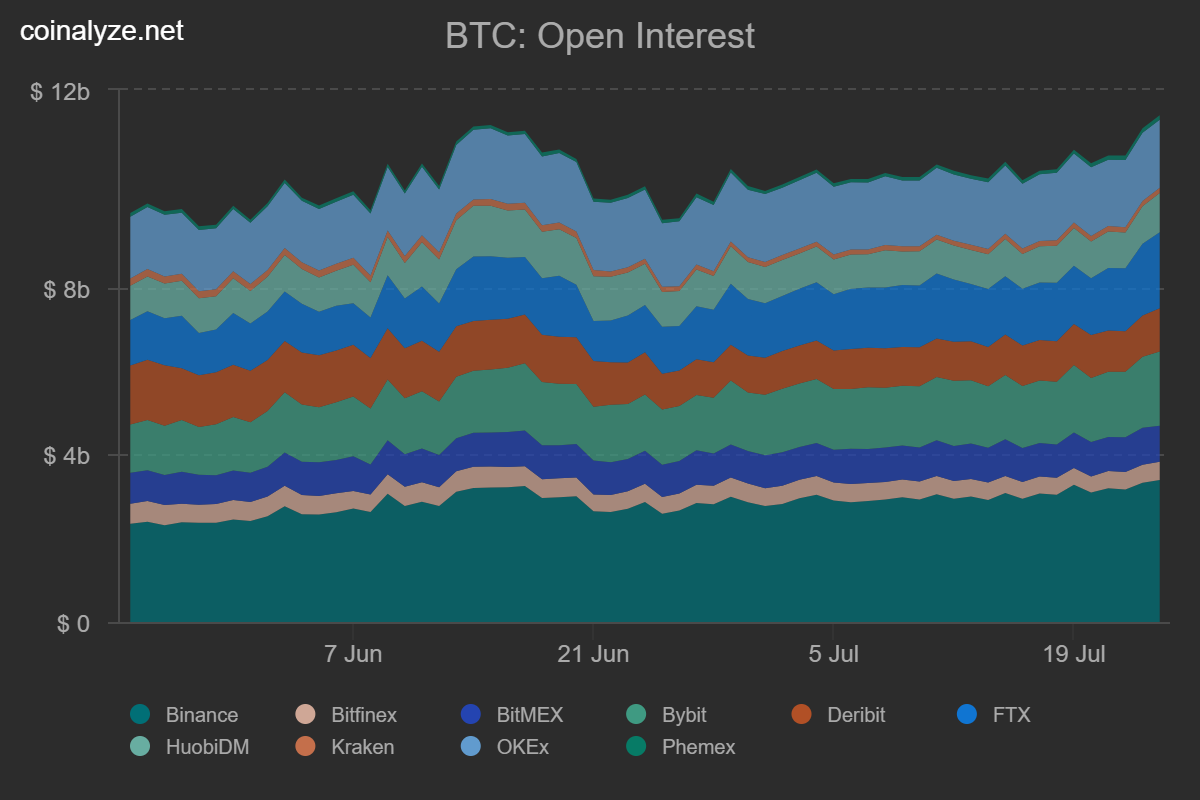
First of all, I want to show you the Open Interest hit a new high in 2 months,11 Billion dollars in value, together with the information that the majority of the market is long gives me the impression that the market is bullish.

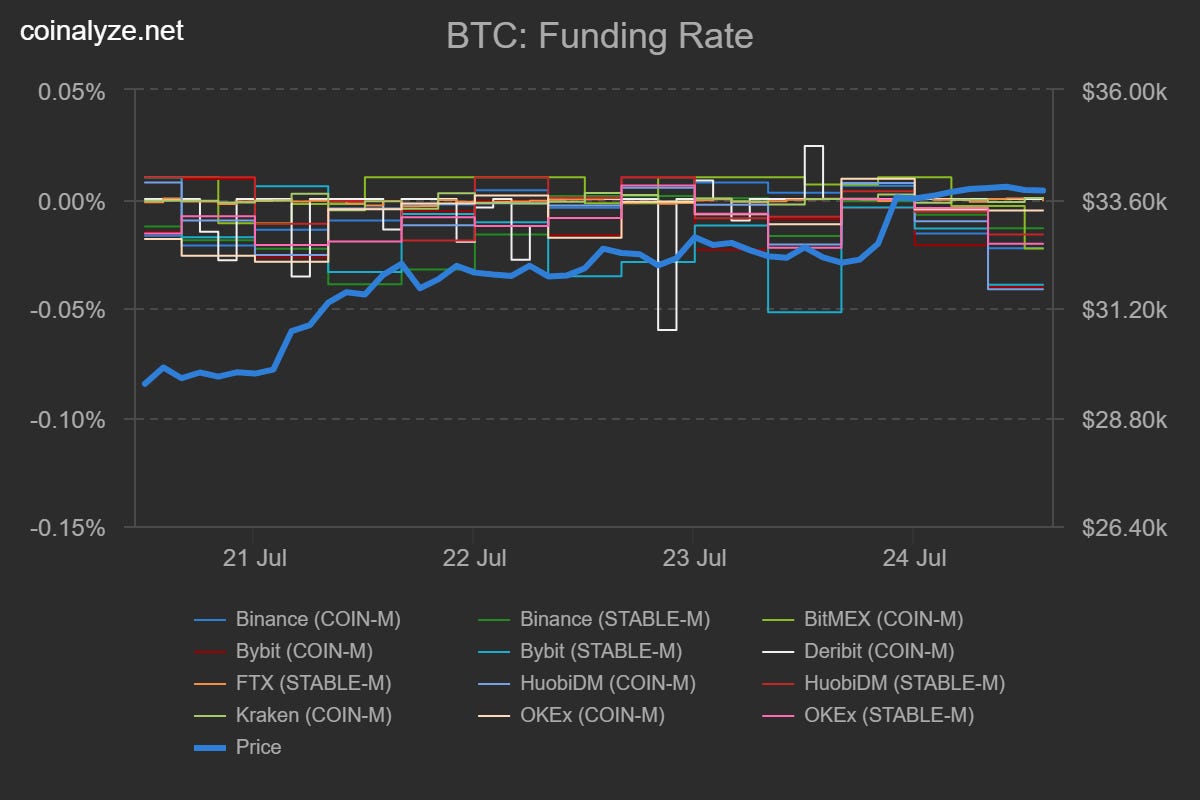
Another interesting metric to look at is Funding Rate. When the rate is positive, long positions periodically pay short positions. Conversely, when the rate is negative, short positions periodically pay long positions, and it is currently negative.
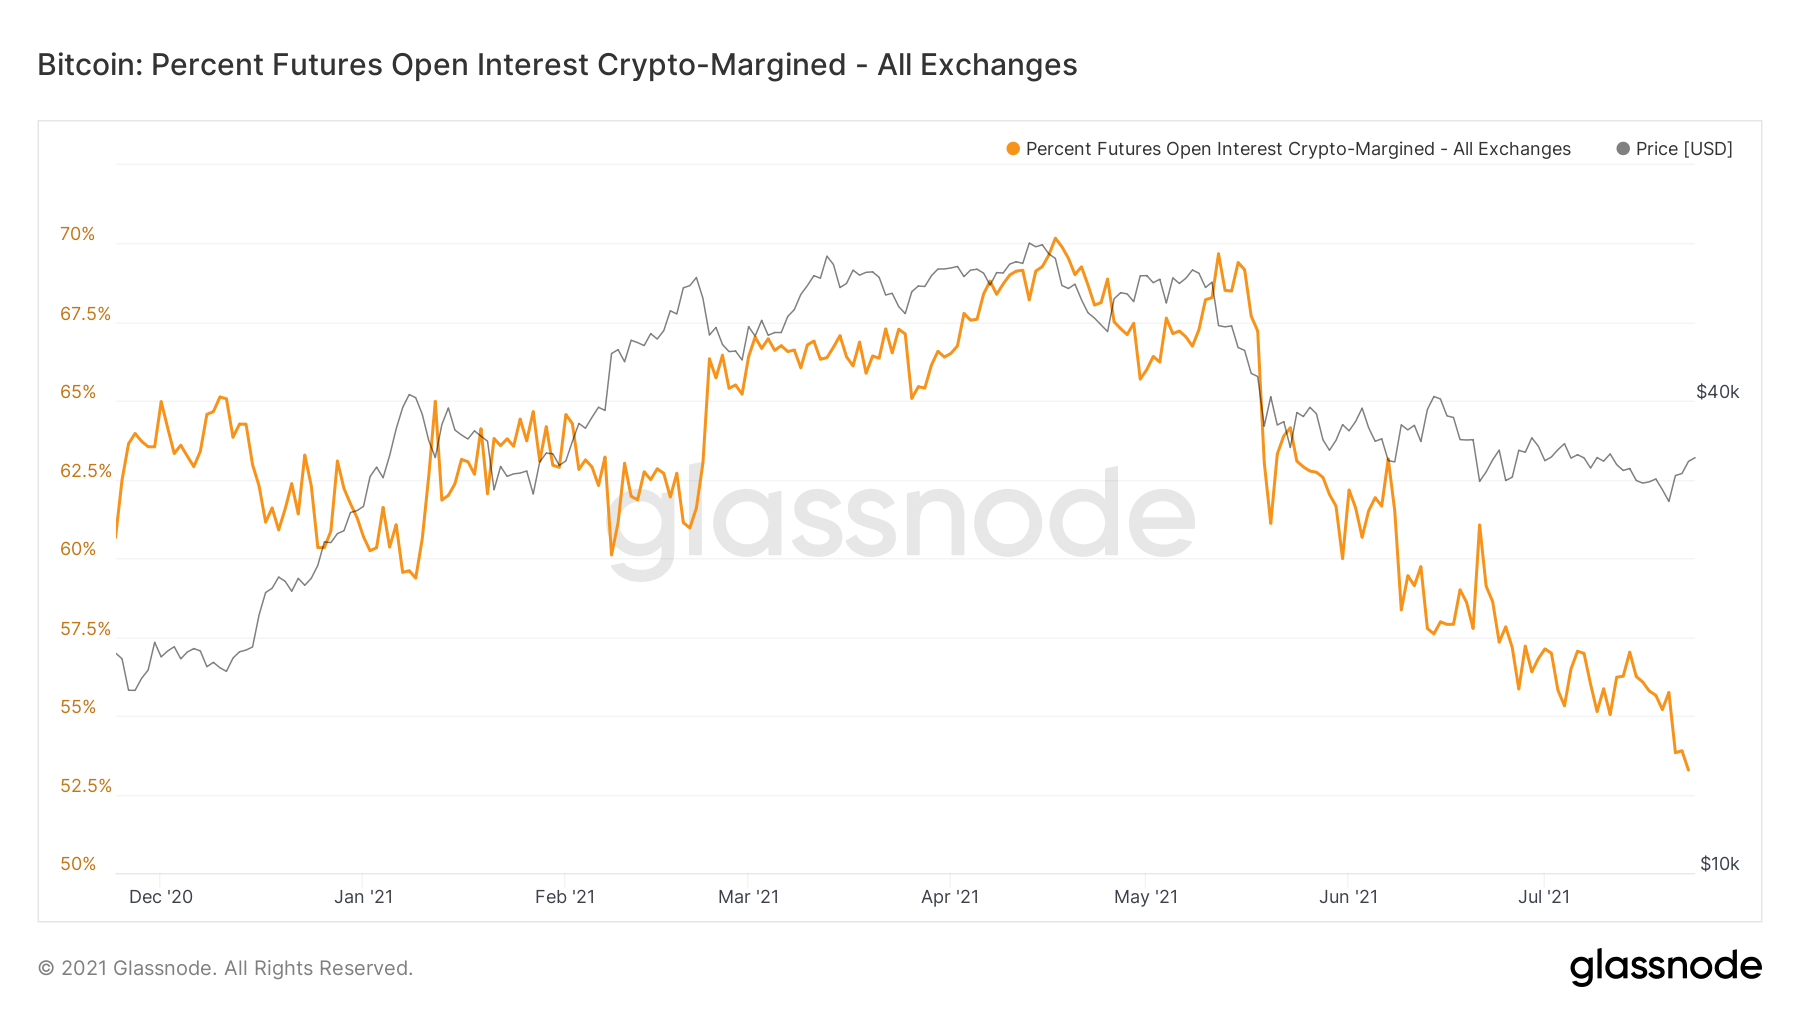
Also, I’m keeping an eye on the Percent Futures Open Interest Crypto-Margined, which has been decreasing since May. This also tells me that traders are not willing to risk their coins.
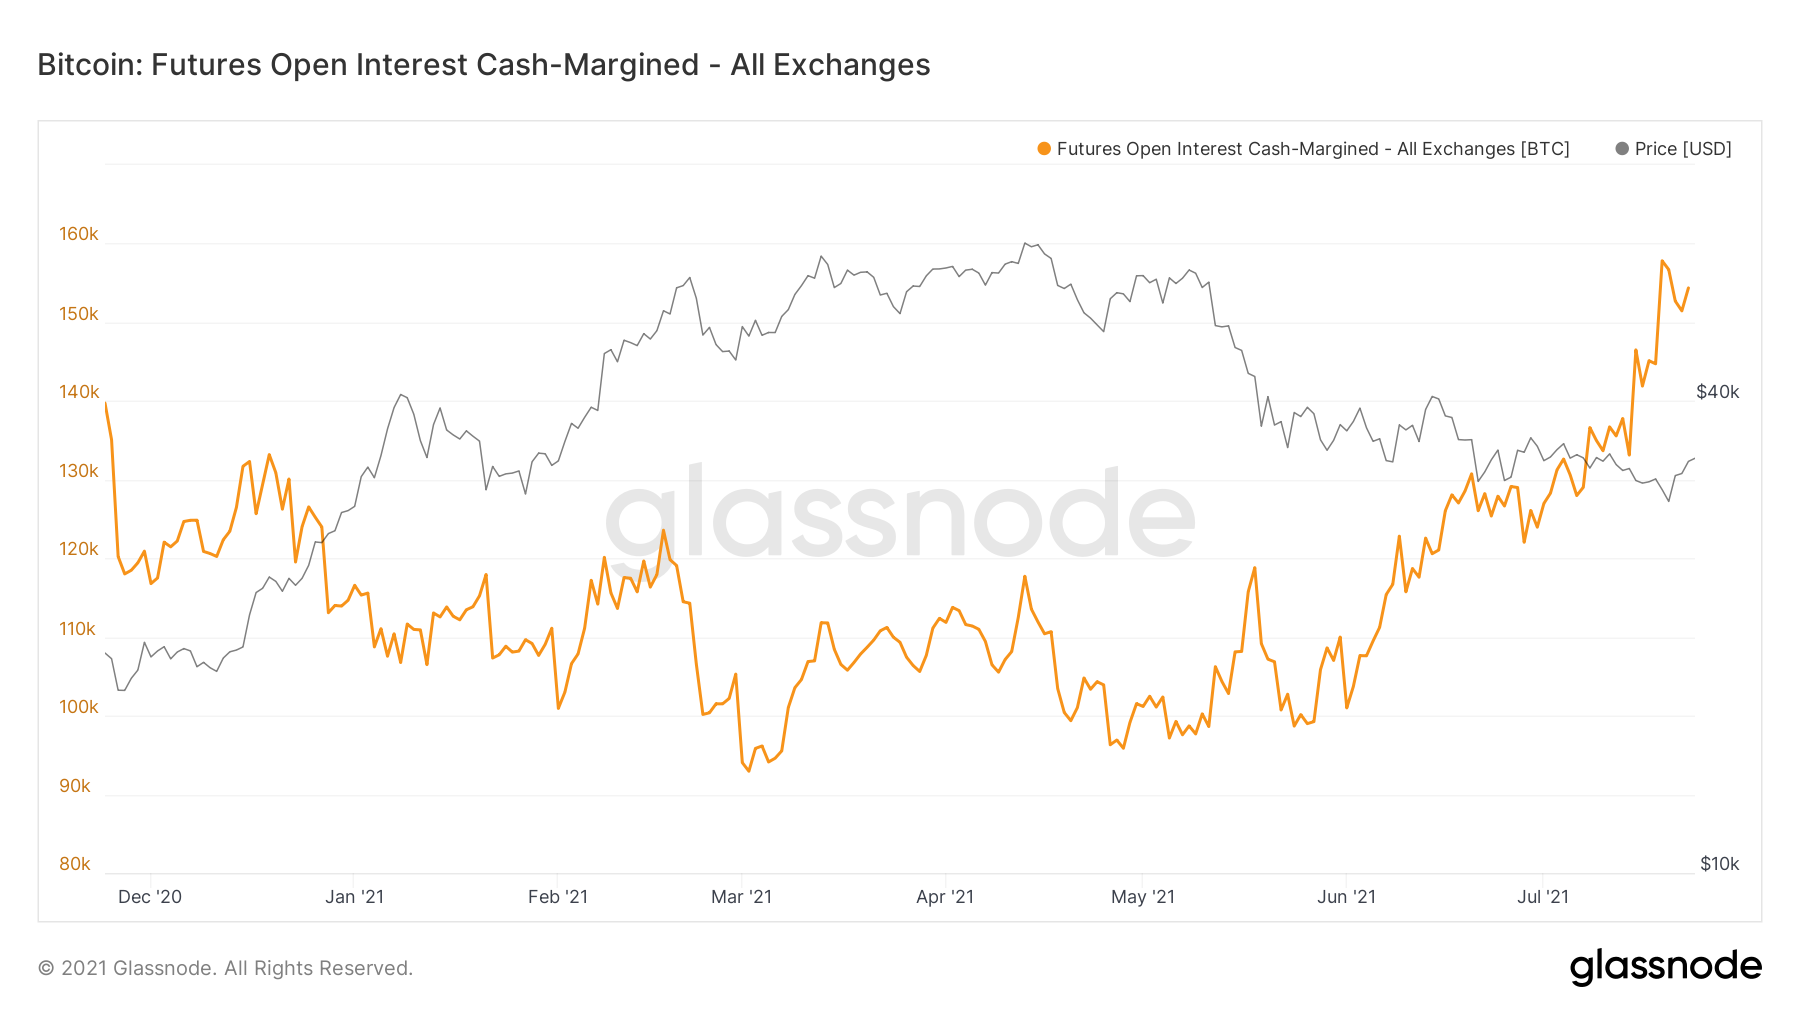
And the number of traders using USD or any other stablecoin pegged to the dollar has also been increasing since May.
I will also put here an on-chain metric that I saw on Clemente’s Twitter. His thesis, which I agree with, is that we will have a supply squeeze because a lot of coins are illiquidit, this means that the owners are not willing to sell them. So with the increase in the demand and the decrease in the supply price would go up.

The last on-chain metric that I will put here is the ASOL, Average Spent Output Lifespan. It basically says the average age of the coins when they were last moved.
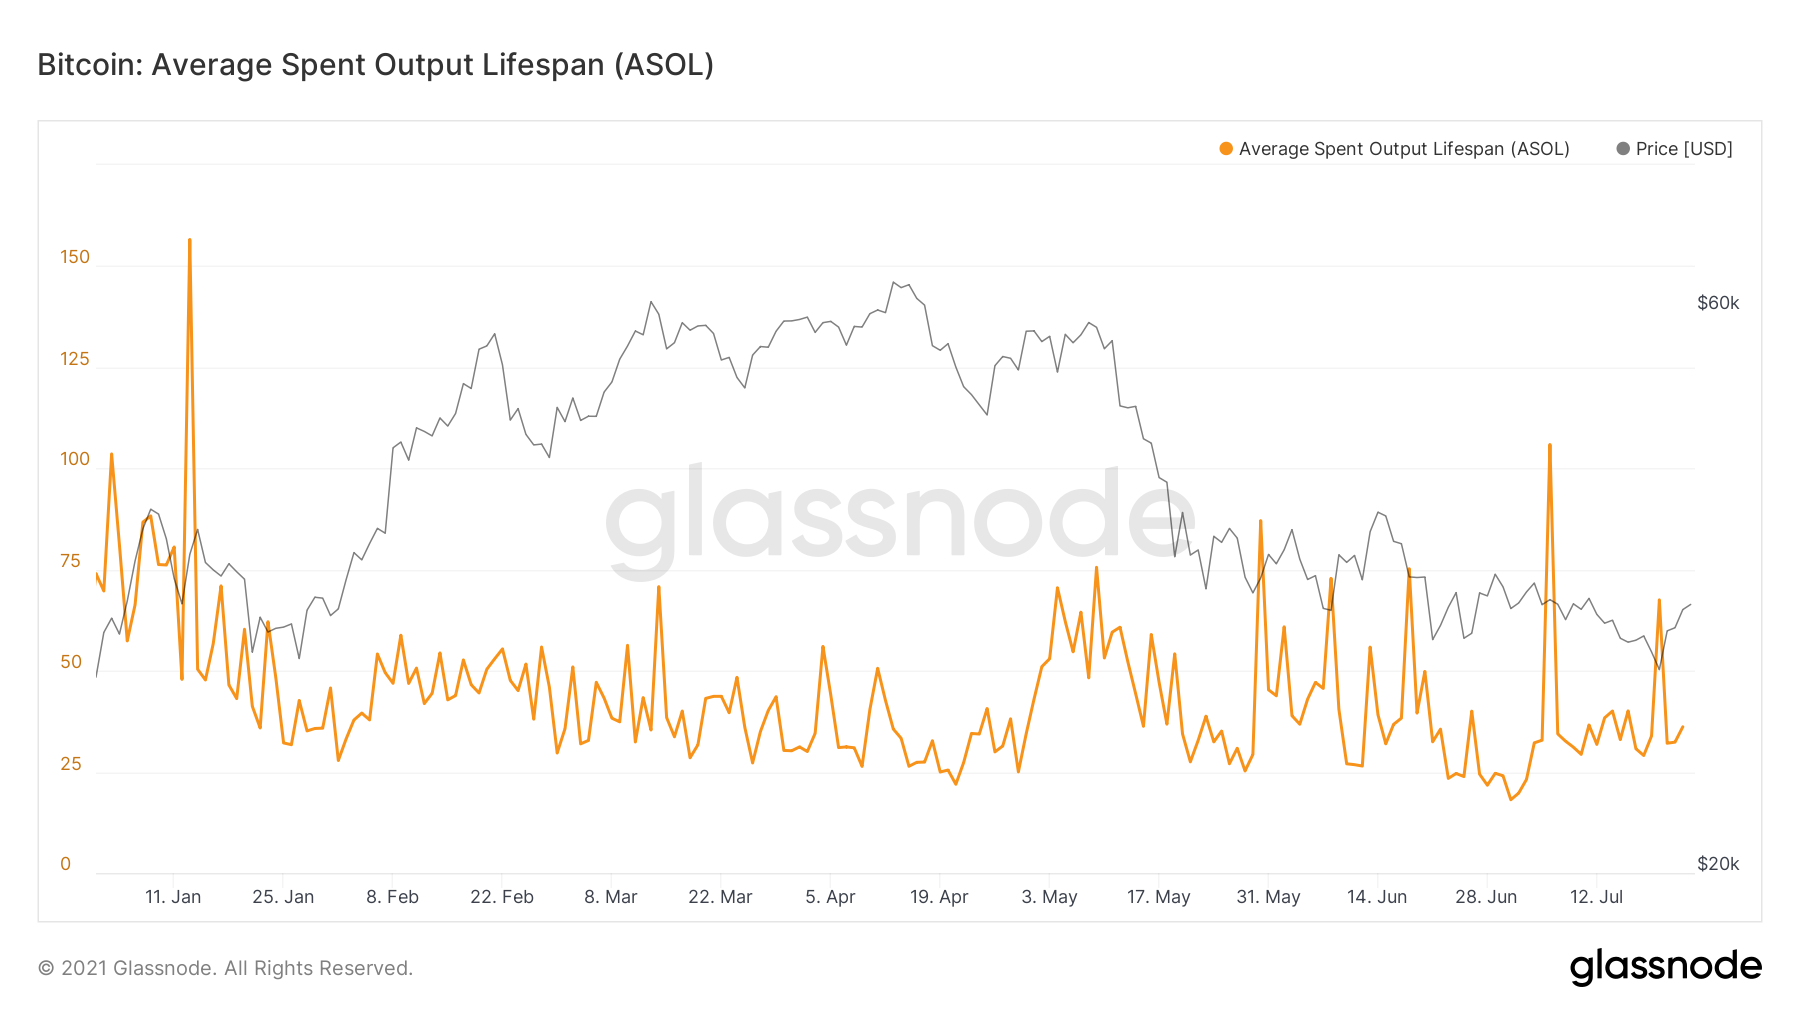
Low value, like now that it’s 36, indicates that young coins are being spent.
Charts
Let’s observe some technical indicators that I’ve been watching this week and share my thoughts on them.
But first let me remember that the charts gave me a good view of what would happening in the week and it did happen, look at what I wrote:

It feels nice when you make the right call.
Observe the Daily RSI. For those who don’t know, RSI has been in a downtrend and now has crossed the trending line, which means that bitcoin is having more buying volume than selling, and on-chain tells us that is the big money that is buying.

Another interesting indicator to watch closely is the 50 days moving average and the 200 moving average. The first confirmation that we’re crossing the river, like Julius Caeser, is the 50 day MA. Which is currently at 34.325, if we cross it, it will be the first signal that the bull run isn’t over.
The other signal that the bull run isn’t over is the increase on the spot volume, which is happening. 21 billion was the volume this week, an increase from last week. The RSI itself shows us an increase in volume.
The final confirmation is the 200 days MA. When we cross it, is because we crossed the river and the bull run is definitely not over yet. The 200 day MA is currently at 44.671. Let’s take a look at the chart.

If we close today above the 50 daily MA it will be a very nice closing, remembering that I’m writing this on Saturday.
In conclusion, if bitcoin does what I’m expecting it to do we will see the 40k levels again, I’m betting that it will happen in August.
As I said on my Twitter:

That’s all that I had to say. Hope it will useful to you, and also don’t forget to subscribe to always receive my newsletter in your email. Also, follow me on Twitter: FVonPaumgartten
Thanks for reading it, cheers.